Private landlord possession claims in Manchester reached 153 between April and June 2026, up 35 per cent on a year earlier, against 4.8 per cent across England and Wales. Only one quarter since the series began in 2003 was higher: January to March 2005, at 155.
Adding accelerated claims, the fast-track court route for Section 21 notices, Manchester rose 17 per cent against 10 per cent nationally. This wider measure allows for landlords switching between the two routes, and it becomes the fairer comparison as the accelerated route closes.
Built from official Ministry of Justice data. Free to cite and download. Next update due on 12 November 2026, when the Ministry of Justice is scheduled to publish.
By Omid Behzadnia, Beacon Living Group. Published 15 September 2026. Updated 29 September 2026 (added the every-council and repossessions data, the national comparison chart and clearer Section 21 wording). Source: Ministry of Justice, Mortgage and Landlord Possession Statistics, April to June 2026. Declared interest: Beacon Living Group manages rented homes in Greater Manchester on behalf of landlords.
| Supporting figures | Figure |
|---|---|
| Manchester private landlord claims a year earlier, Apr to Jun 2025 | 113 |
| Size of the rise by number of claims. Only Enfield (+59) and Haringey (+55) were larger | +40 |
| Rank by number of extra claims, among 317 councils in England and Wales (full list in the national CSV) | 3rd |
| Rank by percentage rise, among the 32 councils with 50 or more claims in Apr to Jun 2025 | 6th of 32 |
| Median percentage change across those 32 councils | +2.4% |
| Manchester private landlord plus accelerated claims, up 17% (England and Wales up 10%) | 296 |
| Manchester and Salford private landlord claims added together (a Beacon aggregate, not an official area). Highest since the series began in 2003, previous high 203 | 226 |
| Manchester landlord possession claims of all types | 411 |
Section 21 no-fault eviction was abolished on 1 May 2026. From that date landlords could no longer serve a new Section 21 notice, although claims on notices already served could still be issued until 31 July. April to June 2026 is the first quarter to include the change. These are the first Ministry of Justice figures to cover it. They were published on 13 August 2026 and updated on 19 August.
It also broke a pattern. In each of the previous four years, Manchester's private landlord claims fell from the first quarter of the year to the second. This year they rose, from 132 to 153.
An important caution. The Ministry of Justice says it is not clear whether changes in claims "can be attributed to commencement of the Act", and that it will keep monitoring the trend. These figures show what happened. They do not show why, and a single quarter is not a trend.
Manchester and Salford added 56 private landlord claims between them, more than Greater Manchester's net rise of 53. The other eight boroughs combined fell slightly, from 222 to 219, and four of them recorded falls. Counting accelerated claims as well, those eight boroughs rose 7.5 per cent, against 17 per cent in Manchester.
| Borough | 2025 | 2026 | Change | % |
|---|---|---|---|---|
| Manchester | 113 | 153 | +40 | +35% |
| Salford | 57 | 73 | +16 | +28% |
| Wigan | 27 | 33 | +6 | +22% |
| Tameside | 24 | 25 | +1 | +4% |
| Oldham | 29 | 30 | +1 | +3% |
| Bolton | 35 | 36 | +1 | +3% |
| Bury | 27 | 26 | −1 | −4% |
| Rochdale | 38 | 36 | −2 | −5% |
| Trafford | 18 | 16 | −2 | −11% |
| Stockport | 24 | 17 | −7 | −29% |
Private landlord possession claims, April to June 2025 and April to June 2026. Percentages on small numbers swing sharply: Trafford's fall is two claims. Beacon Living Group analysis of Ministry of Justice local authority data.
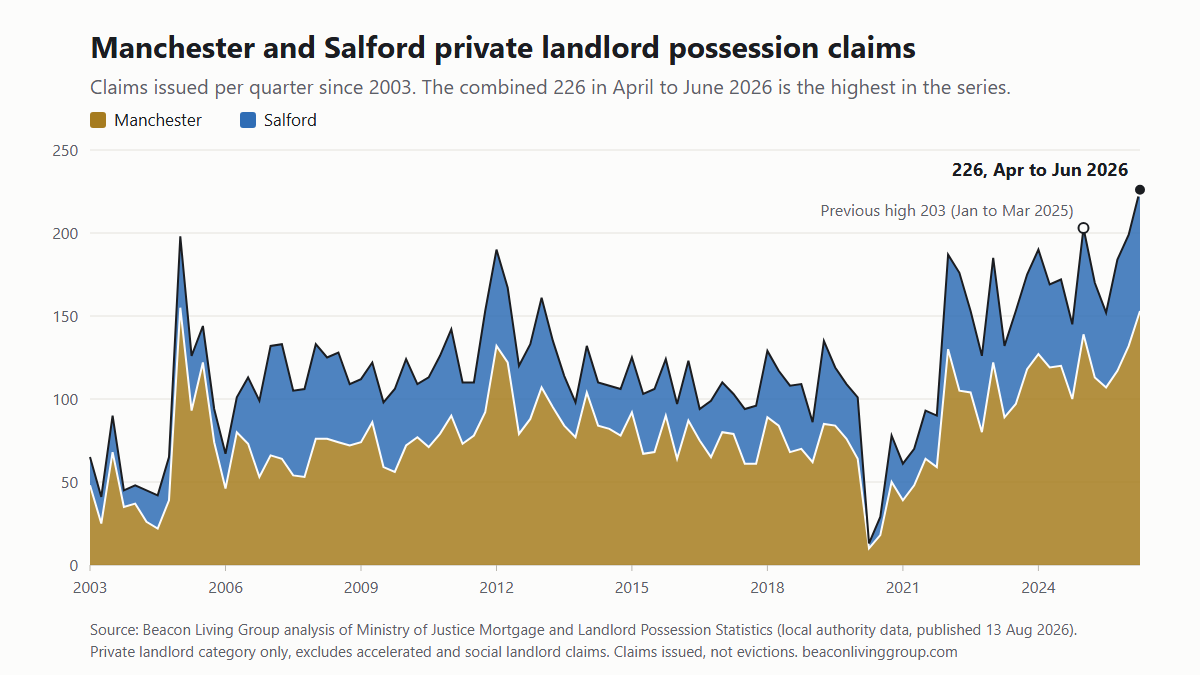
In short: Manchester and Salford combined reached 226 private landlord claims in April to June 2026, above the previous high of 203 in January to March 2025.
Across England and Wales, 32 local authorities recorded at least 50 private landlord possession claims in April to June 2025, a threshold we use so that percentage changes are not driven by a handful of cases. All 32 are in England. Manchester ranked sixth of those 32 for the percentage size of its increase. The median change across the group was 2.4 per cent. Measured by the number of extra claims instead, Manchester's rise of 40 was the third-largest in England and Wales, behind Enfield (59) and Haringey (55).
| Council | 2025 | 2026 | Extra claims | % change |
|---|---|---|---|---|
| Haringey | 93 | 148 | +55 | +59.1% |
| Enfield | 146 | 205 | +59 | +40.4% |
| Hounslow | 62 | 87 | +25 | +40.3% |
| Westminster | 90 | 126 | +36 | +40.0% |
| Leeds | 66 | 91 | +25 | +37.9% |
| Manchester | 113 | 153 | +40 | +35.4% |
| Salford | 57 | 73 | +16 | +28.1% |
| Birmingham | 123 | 157 | +34 | +27.6% |
| Ealing | 103 | 130 | +27 | +26.2% |
| Bradford | 52 | 61 | +9 | +17.3% |
Largest percentage rises in private landlord claims, April to June 2026 against 2025. Top 10 of the 32 councils in England and Wales with 50 or more claims in April to June 2025 (none in Wales qualify). Source: Ministry of Justice. Download every council, CSV (the 32 qualifying councils are flagged, and the national total is included).
Four of the five councils above Manchester are London boroughs. The other is Leeds.
What the data supports. Private landlord possession claims in Manchester are at their highest quarterly level in more than twenty years, they rose far faster than the national average, and the increase in that category is concentrated in Manchester and Salford rather than spread across Greater Manchester. Allowing for landlords switching from the accelerated route, Manchester's private landlord and accelerated claims together still rose 17 per cent, from 253 to 296, against 10 per cent across England and Wales. That combined total is not a record: it was higher in January to March 2025 (333) and in the first half of 2024.
Claims are not evictions. Across England and Wales, landlord warrants fell 6 per cent and landlord repossessions fell 3 per cent in the same quarter, counting all types of landlord. In Manchester, private landlord repossessions were 44, against 25 a year earlier (the private_landlord_repossessions column in the Greater Manchester CSV below). That is not unusual for the city: there were 46 in April to June 2024 and 44 in July to September 2024, so the 2025 figure was a low point. Repossessions mostly follow claims made months earlier, so they trail the claims figures.
What it does not support. It does not show that the Renters' Rights Act caused this, and the Ministry of Justice says so directly. There are other plausible explanations that this data cannot separate. The first is timing. Landlords with a Section 21 notice served before 1 May 2026 had to start court proceedings by 31 July 2026 at the latest, so some of the rise may be landlords bringing forward claims they would otherwise have made later. Accelerated claims rose 16 per cent nationally in the same quarter, which is consistent with a rush to use the old route before it closed. In Manchester, though, accelerated claims were almost flat, at 143 against 140, so any rush did not show up in the city's accelerated figures. Section 21 claims can also be brought on the standard procedure, so a rush through the standard route cannot be ruled out. Once claims on old Section 21 notices end on 31 July, cases that would have been accelerated claims should be counted as private landlord claims. The private landlord series on its own is then likely to rise for structural reasons, so from the July to September figures the combined private plus accelerated total is the like-for-like measure. The second is ordinary volatility: Manchester's count fell from 139 to 113 within 2025, so a one-quarter swing of this size has happened before. The November release covers July to September, which includes that 31 July deadline, and will be a far better guide.
What we will do next. The next Ministry of Justice release is due on 12 November 2026 and covers July to September, which includes the 31 July cut-off for starting claims on old Section 21 notices. October to December should be the first full quarter with no new claims on Section 21 notices. This page will be updated on the day of the release, and the comparison that matters will be whether Manchester stays above the national trend once the transitional rush has washed through.
Short form
Beacon Living Group analysis of Ministry of Justice possession statistics, April to June 2026.
Full citation
Beacon Living Group (2026) Manchester Possession Claims Tracker. Analysis of Ministry of Justice Mortgage and Landlord Possession Statistics, April to June 2026. Available at: https://beaconlivinggroup.com/manchester-possession-claims-data.html
Version
April to June 2026 edition. First published 15 September 2026, updated 29 September 2026 to add the every-council and repossessions data, the national comparison chart and clearer Section 21 wording.
Journalists and researchers are welcome to use these figures without asking. If you would like the underlying workings, a comment, or a different cut of the data such as a specific borough or a longer run of quarters, email omid@beaconlivinggroup.com and we will send it the same day. Company background is in our press kit.
The full dataset behind this page covers all ten Greater Manchester boroughs, every quarter from 2003 Q1 to 2026 Q2, split by claim type. It is a plain CSV and it is free to use.
Columns: local_authority; year; quarter (Q1 = Jan to Mar, Q2 = Apr to Jun, Q3 = Jul to Sep, Q4 = Oct to Dec); accelerated_claims; private_landlord_claims; social_landlord_claims; total_landlord_claims (the sum of the three); la_code (ONS local authority code); private_landlord_repossessions.
Download the CSV, 940 rowsDownload every council, CSVDownload the chart, PNG
Omid Behzadnia compiled this analysis and is happy to talk it through with journalists, researchers or landlords.
This tracker is rebuilt every quarter from the Ministry of Justice possession statistics. Adding Beacon as a preferred source changes only your own Google results.